Black Lives Matter. Support the Equal Justice Initiative.
Skip to main contentCarbon Design System

Basic charts

Basic charts offer a way to visualize data sets in an intuitive, easy to understand way. Every chart should tell a story and should reflect the content on the page where it is found.

Bar chart

Default

Bar charts use vertical or horizontal data markers to compare individual values. You can use them to compare discrete data or show trends over time.

Simple bar (discrete)010,00020,00030,00040,00050,00060,00070,000QtyMoreSoldRestockingMiscQtyMoreSoldRestockingMisc
Simple bar (time series)010,00020,00030,00040,00050,00060,00070,000Mon 312019Wed 02Thu 03Fri 04Sat 05Jan 06Mon 07Tue 08QtyMoreSoldRestockingMiscellaneous

Grouped bar chart

A grouped bar chart, also known as a clustered bar graph, multi-set bar chart, or grouped column chart, is a type of bar graph that is used to compare values across multiple categories.

Grouped bar (discrete)-60,000-40,000-20,000020,00040,00060,000QtyMoreSoldRestockingMiscDataset 1Dataset 2Dataset 3Dataset 4

Stacked bar

Stacked bar charts are useful for comparing proportional contributions within a category. They plot the relative value that each data series contributes to the total.
Stacked bar (discrete)020,00040,00060,00080,000100,000120,000140,000160,000180,000200,000QtyMoreSoldRestockingMiscDataset 1Dataset 2Dataset 3Dataset 4
Stacked bar (time series)020,00040,00060,00080,000100,000120,000140,000160,000180,000200,000Mon 312019Thu 03Sat 05Mon 07Wed 09Fri 11Jan 13Tue 15Thu 17Sat 19Dataset 1Dataset 2Dataset 3Dataset 4

Horizontal bar

Default

Bar charts use vertical or horizontal data markers to compare individual values. You can use them to compare discrete data or show trends over time.

Simple horizontal bar (discrete)QtyMoreSoldRestockingMisc010,00020,00030,00040,00050,00060,00070,000QtyMoreSoldRestockingMisc
Simple horizontal bar (time series)Mon 312019Wed 02Thu 03Fri 04Sat 05Jan 06Mon 07Tue 08010,00020,00030,00040,00050,00060,00070,000QtyMoreSoldRestockingMiscellaneous

Grouped bar chart

A grouped bar chart, also known as a clustered bar graph, multi-set bar chart, or grouped column chart, is a type of bar graph that is used to compare values across multiple categories.

Grouped horizontal bar (discrete)QtyMoreSoldRestockingMisc-60,000-40,000-20,000020,00040,00060,000Dataset 1Dataset 2Dataset 3Dataset 4

Stacked bar

Stacked bar charts are useful for comparing proportional contributions within a category. They plot the relative value that each data series contributes to the total.
Stacked horizontal bar (discrete)QtyMoreSoldRestockingMisc020,00040,00060,00080,000100,000120,000140,000160,000180,000200,000Dataset 1Dataset 2Dataset 3Dataset 4
Stacked horizontal bar (time series)Mon 312019Thu 03Sat 05Mon 07Wed 09Fri 11Jan 13Tue 15Thu 17Sat 19020,00040,00060,00080,000100,000120,000140,000160,000180,000200,000Dataset 1Dataset 2Dataset 3Dataset 4

Line chart

Default

Line charts plot data at regular intervals connected by lines. You can use line visualizations to show trends over time and compare several data sets.

Line (discrete)010,00020,00030,00040,00050,00060,00070,00080,000QtyMoreSoldRestockingMisc2018 Annual Sales FiguresDataset 1Dataset 2Dataset 3 long nameDataset 4 long nameDataset 5 long nameDataset 6 long name
Line (time series)010,00020,00030,00040,00050,00060,00070,000Mon 312019Thu 03Sat 05Mon 07Wed 09Fri 11Jan 13Tue 15Thu 17Sat 19Dataset 1Dataset 2Dataset 3Dataset 4

Stepped line chart

Stepped line charts plot data at regular intervals, forming a series of steps between data points. You can use line visualizations to show trends over time and compare several data sets.

Step (discrete)010,00020,00030,00040,00050,00060,00070,00080,000QtyMoreSoldRestockingMisc2018 Annual Sales FiguresDataset 1Dataset 2Dataset 3 long nameDataset 4 long nameDataset 5 long nameDataset 6 long name

Curved line chart

Line (time series)010,00020,00030,00040,00050,00060,00070,000Mon 312019Thu 03Sat 05Mon 07Wed 09Fri 11Jan 13Tue 15Thu 17Sat 19Dataset 1Dataset 2Dataset 3Dataset 4

Area chart

Default

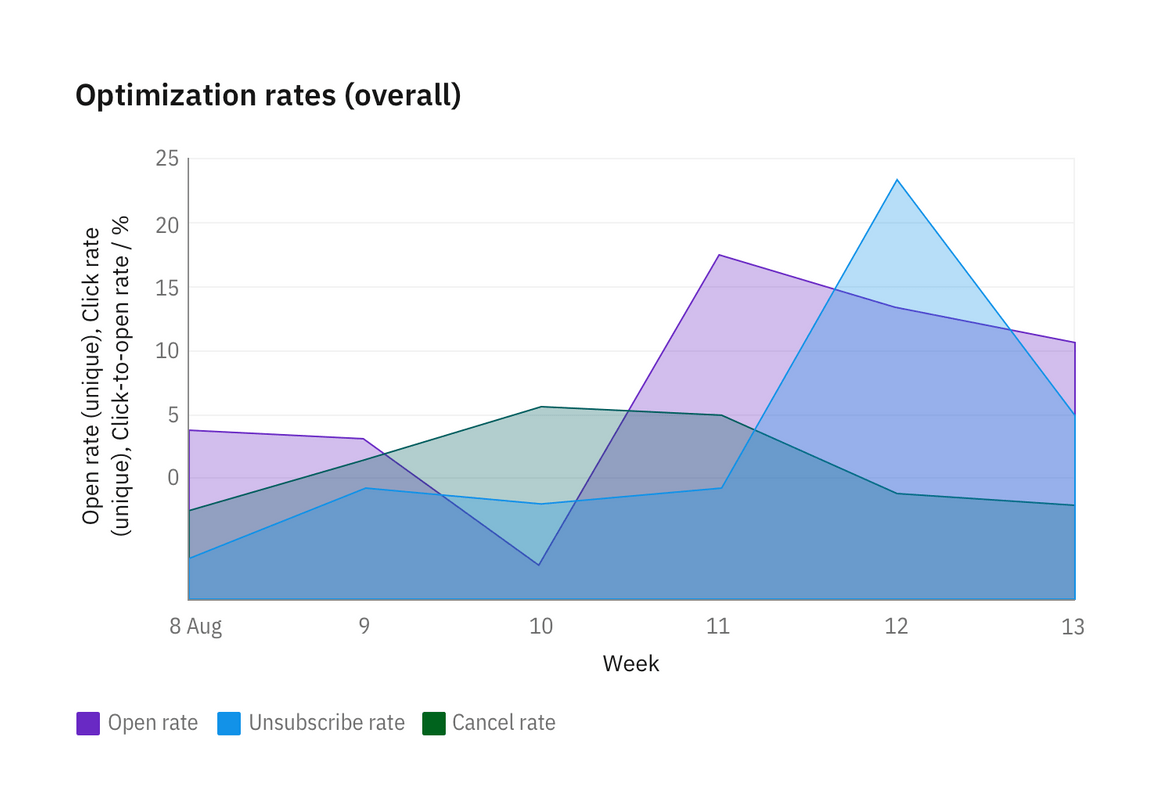
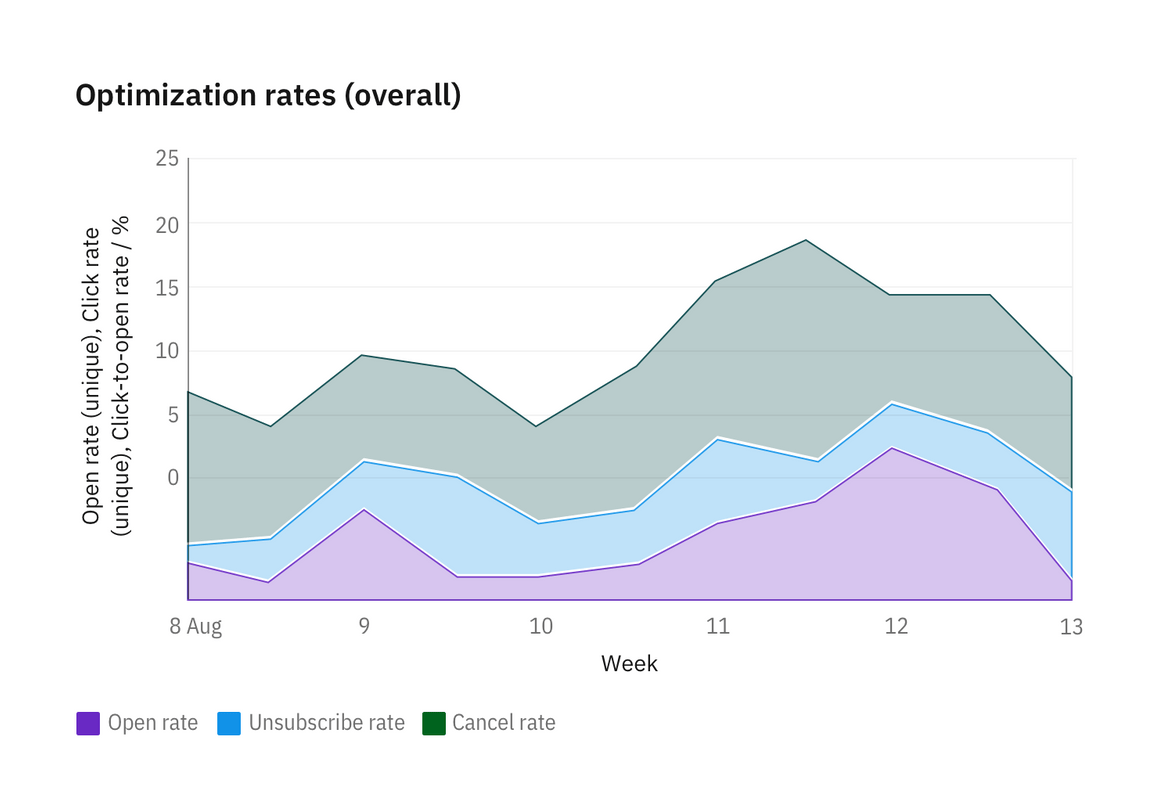
Area charts are similar to line charts, but the areas below the lines are filled with colors or patterns. Stacked charts are useful for comparing proportional contributions within a category. They plot the relative value that each data series contributes to the total.

Horizontal bar chart

Stacked area chart

Stacked area charts are useful for comparing proportional contributions within a category. They plot the relative value that each data series contributes to the total.

Horizontal bar chart

Polar charts

Pie

Pie38%33%12%10%5%0.6%2V2N 9KYPM version 1L22I P66EP L22I P66EP L22I P66EPJQAI 2M4L1J9DZ F37APYEL48 Q6XK YEL48P66EP L22I L22I

Donut

Donut38%33%12%10%5%0.6%196,200Browsers2V2N 9KYPM version 1L22I P66EP L22I P66EP L22I P66EPJQAI 2M4L1J9DZ F37APYEL48 Q6XK YEL48P66EP L22I L22I

Scatter plots

Default

Scatter plot visualizations use data points to plot two measures anywhere along a scale, not only at regular tick marks. You can use scatter plots to explore correlations between different measures.

Scatter (discrete)010,00020,00030,00040,00050,00060,00070,00080,000QtyMoreSoldRestockingMisc2018 Annual Sales FiguresDataset 1Dataset 2Dataset 3 long nameDataset 4 long nameDataset 5 long nameDataset 6 long name
Scatter (time series)010,00020,00030,00040,00050,00060,00070,000Mon 312019Thu 03Sat 05Mon 07Wed 09Fri 11Jan 13Tue 15Thu 17Sat 192019 Annual Sales FiguresDataset 1Dataset 2Dataset 3Dataset 4

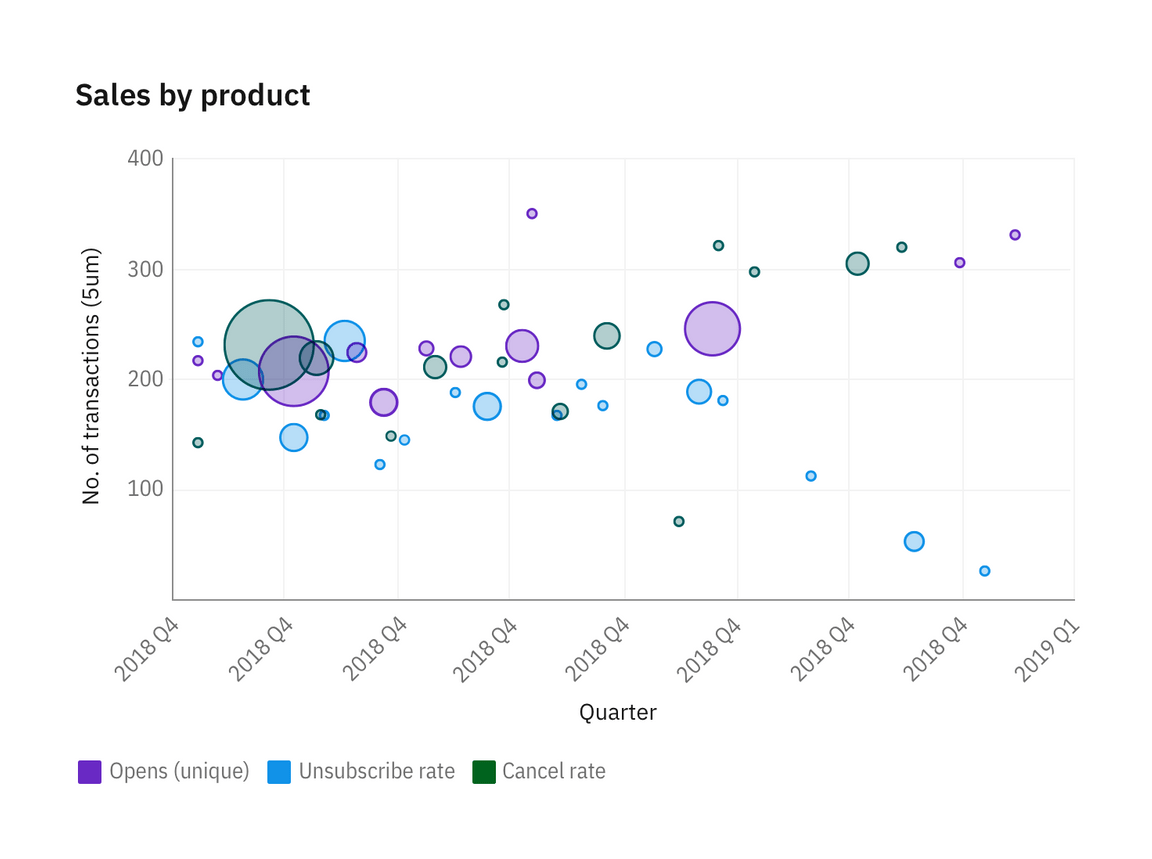
Bubble chart

Bubble charts use data points and bubbles to plot measures anywhere along a scale. One measure is plotted along each axis. The size of the bubble represents the third measure. You can use bubble charts to represent financial data or any data where measured values are related.
Horizontal bar chart

Meter and gauge

Meter and gauge charts are useful for showing values between a small number of variables either by using multiple markers on the same meter or gauge or by using multiples of the chart.
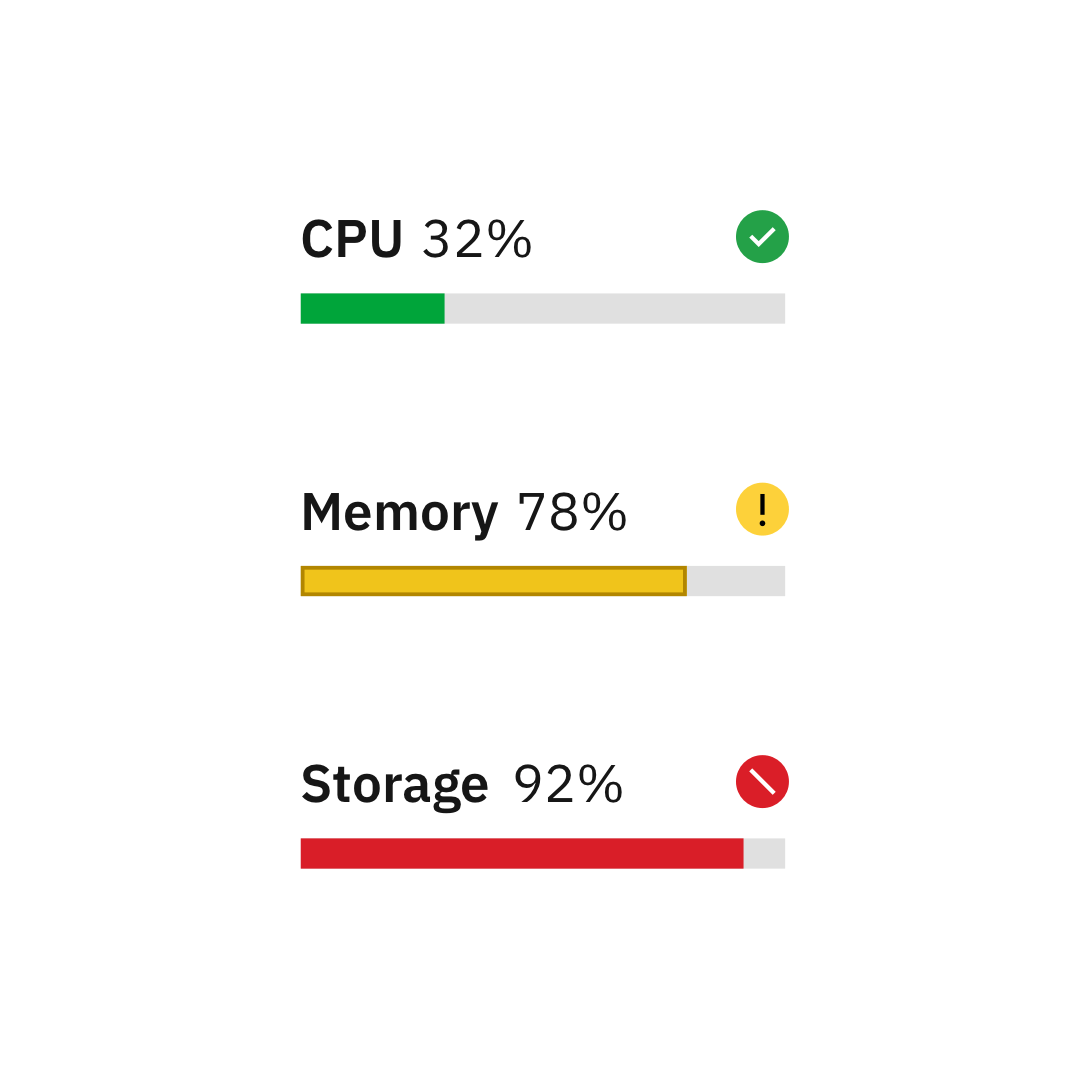
Meters

Meter charts can represent data with current value, minimum and maximum, and peaks or averages.
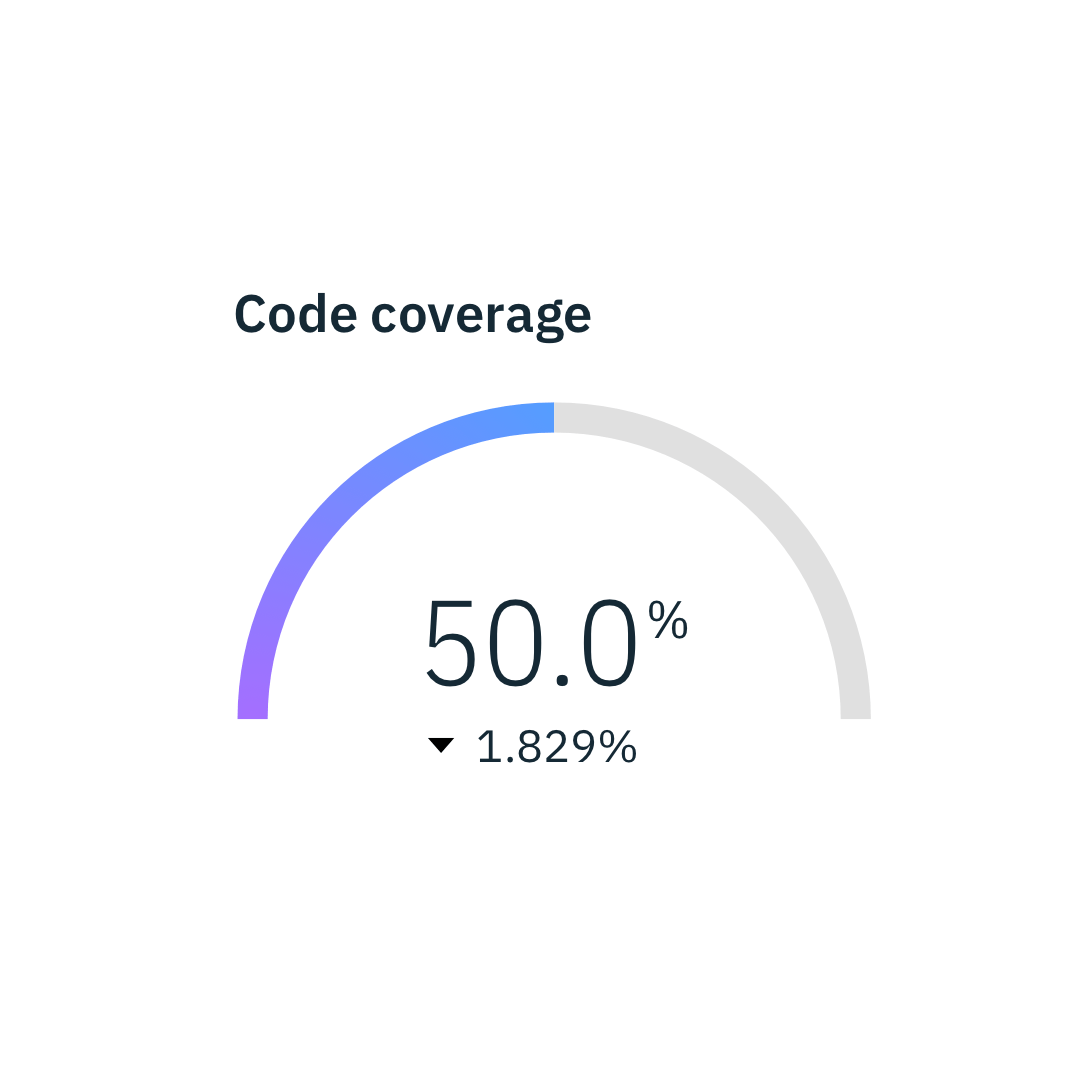
Gauge

Gauge animates to the current value when dashboard loads to create emphasis.